
Introduction
The perceived and reported intensity of pain is influenced by the pain threshold of the person and its tolerance to it, and several factors such as type of trauma, age, race, gender, anxiety may affect the patient’s pain report (1,2). These findings make pain an extremely subjective experience not easily detectable as an objective parameter. Thus, its management turns out to be difficult and consequently health care providers may fail to assess and treat pain in an effective manner, and this may lead to inappropriate pain treatment (3-5).
Otherwise several papers have highlighted that aspects of the patient-physician interaction, such as empathy and explanation, may be very important contributors to produce patient satisfaction than the provision of analgesia (6-8). An appropriate and sensitive physical contact during the assistance can reassure and comfort the patient, giving him a sensation of pain relief (9-11). Also the suggestion about how to manage musculoskeletal immobilisation to reduce the pain sensation would be important (12).
In this context, the analysis of pain change assumes a particular interest, following ED management, as experienced by patients, and the relationship that this change may have with human parameters or external conditions, such as anatomical site of trauma, circumstance of trauma, in patients who did not undergo any pain therapy.
Nevertheless, because of the subjective nature of pain, several methods and pain scales are used to measure pain severity and response to intervention (9,10,13). The most reliable and best validated tool is the Visual Analog Scale (VAS), which is a self-reported measurement of pain severity (14,15).
In the present work we propose a novel interpretation of VAS to obtain analytical and descriptive statistical data. The aim of the present paper is to offer a reliable analysis of musculoskeletal injury in which it can be visualized how human or external conditions influence pain relief, experienced by patients following ED non pharmacological management.
Materials and methods
A prospective observational study was performed on patients admitted to the Trauma Room of the Emergency Department (ED), at our hospital, for acute musculoskeletal trauma from 1st April, 2013 to 30th June, 2014. Exclusion criteria were age under 18 years, trauma occurred before 24 h of acceptance in ED, patients with evident cognitive deficits or otherwise not able to define the intensity of pain, language barrier, patients to whom analgesic therapy was administered before conclusion of the patient response registration. For each patient the detection of the intensity of perceived pain was evaluated employing the VAS (15). The VAS (Fig. 1A) was proposed to patients at their ED admission and at their discharge. For each patient the second VAS proposal was blinded respect to the previous VAS score detected, to avoid bias introduced by a conscious comparison related to previous indication. All patients gave their informed consent for treatment of their data for scientific purpose.
To translate the patient pain change into a semiquantitative analysis, we performed a novel interpretation of the VAS with a normalized VAS (nVAS) according to the procedure detailed below (Figure 1). The first and second patient’s VAS responses were reported on a graduated line, 10 cm long, as the VAS line, and sub-segmented in five intervals of 2 cm each. Then, the initial VAS indication was transferred in coincidence with the middle of the line (that became the 0 point), and the segment generated by the final patient’s VAS indication was read by the observer. The results were then evaluated as follows (Figure 1B): final VAS value included in the
• -1 / +1 cm segment = no change;
• < -1 / ≥ -3 cm segment = lightly diminished;
• < -3 / ≥ -5 cm segment = strongly diminished; • > +1 / ≤ +3 cm segment = lightly augmented;
• > +3 / ≤ +5 cm segment = strongly augmented.
Secondarily, to obtain a descriptive graphic representation of patient’s response distribution in terms of pain relief or worsening, the segment -5 / -1 cm corresponding to relief zone of VAS analysis, and the segment +1 / +5 cm corresponding to worsening pain zone of VAS analysis, were both subdivided into four intervals of 1 cm each, named Levels (Figure 1C).
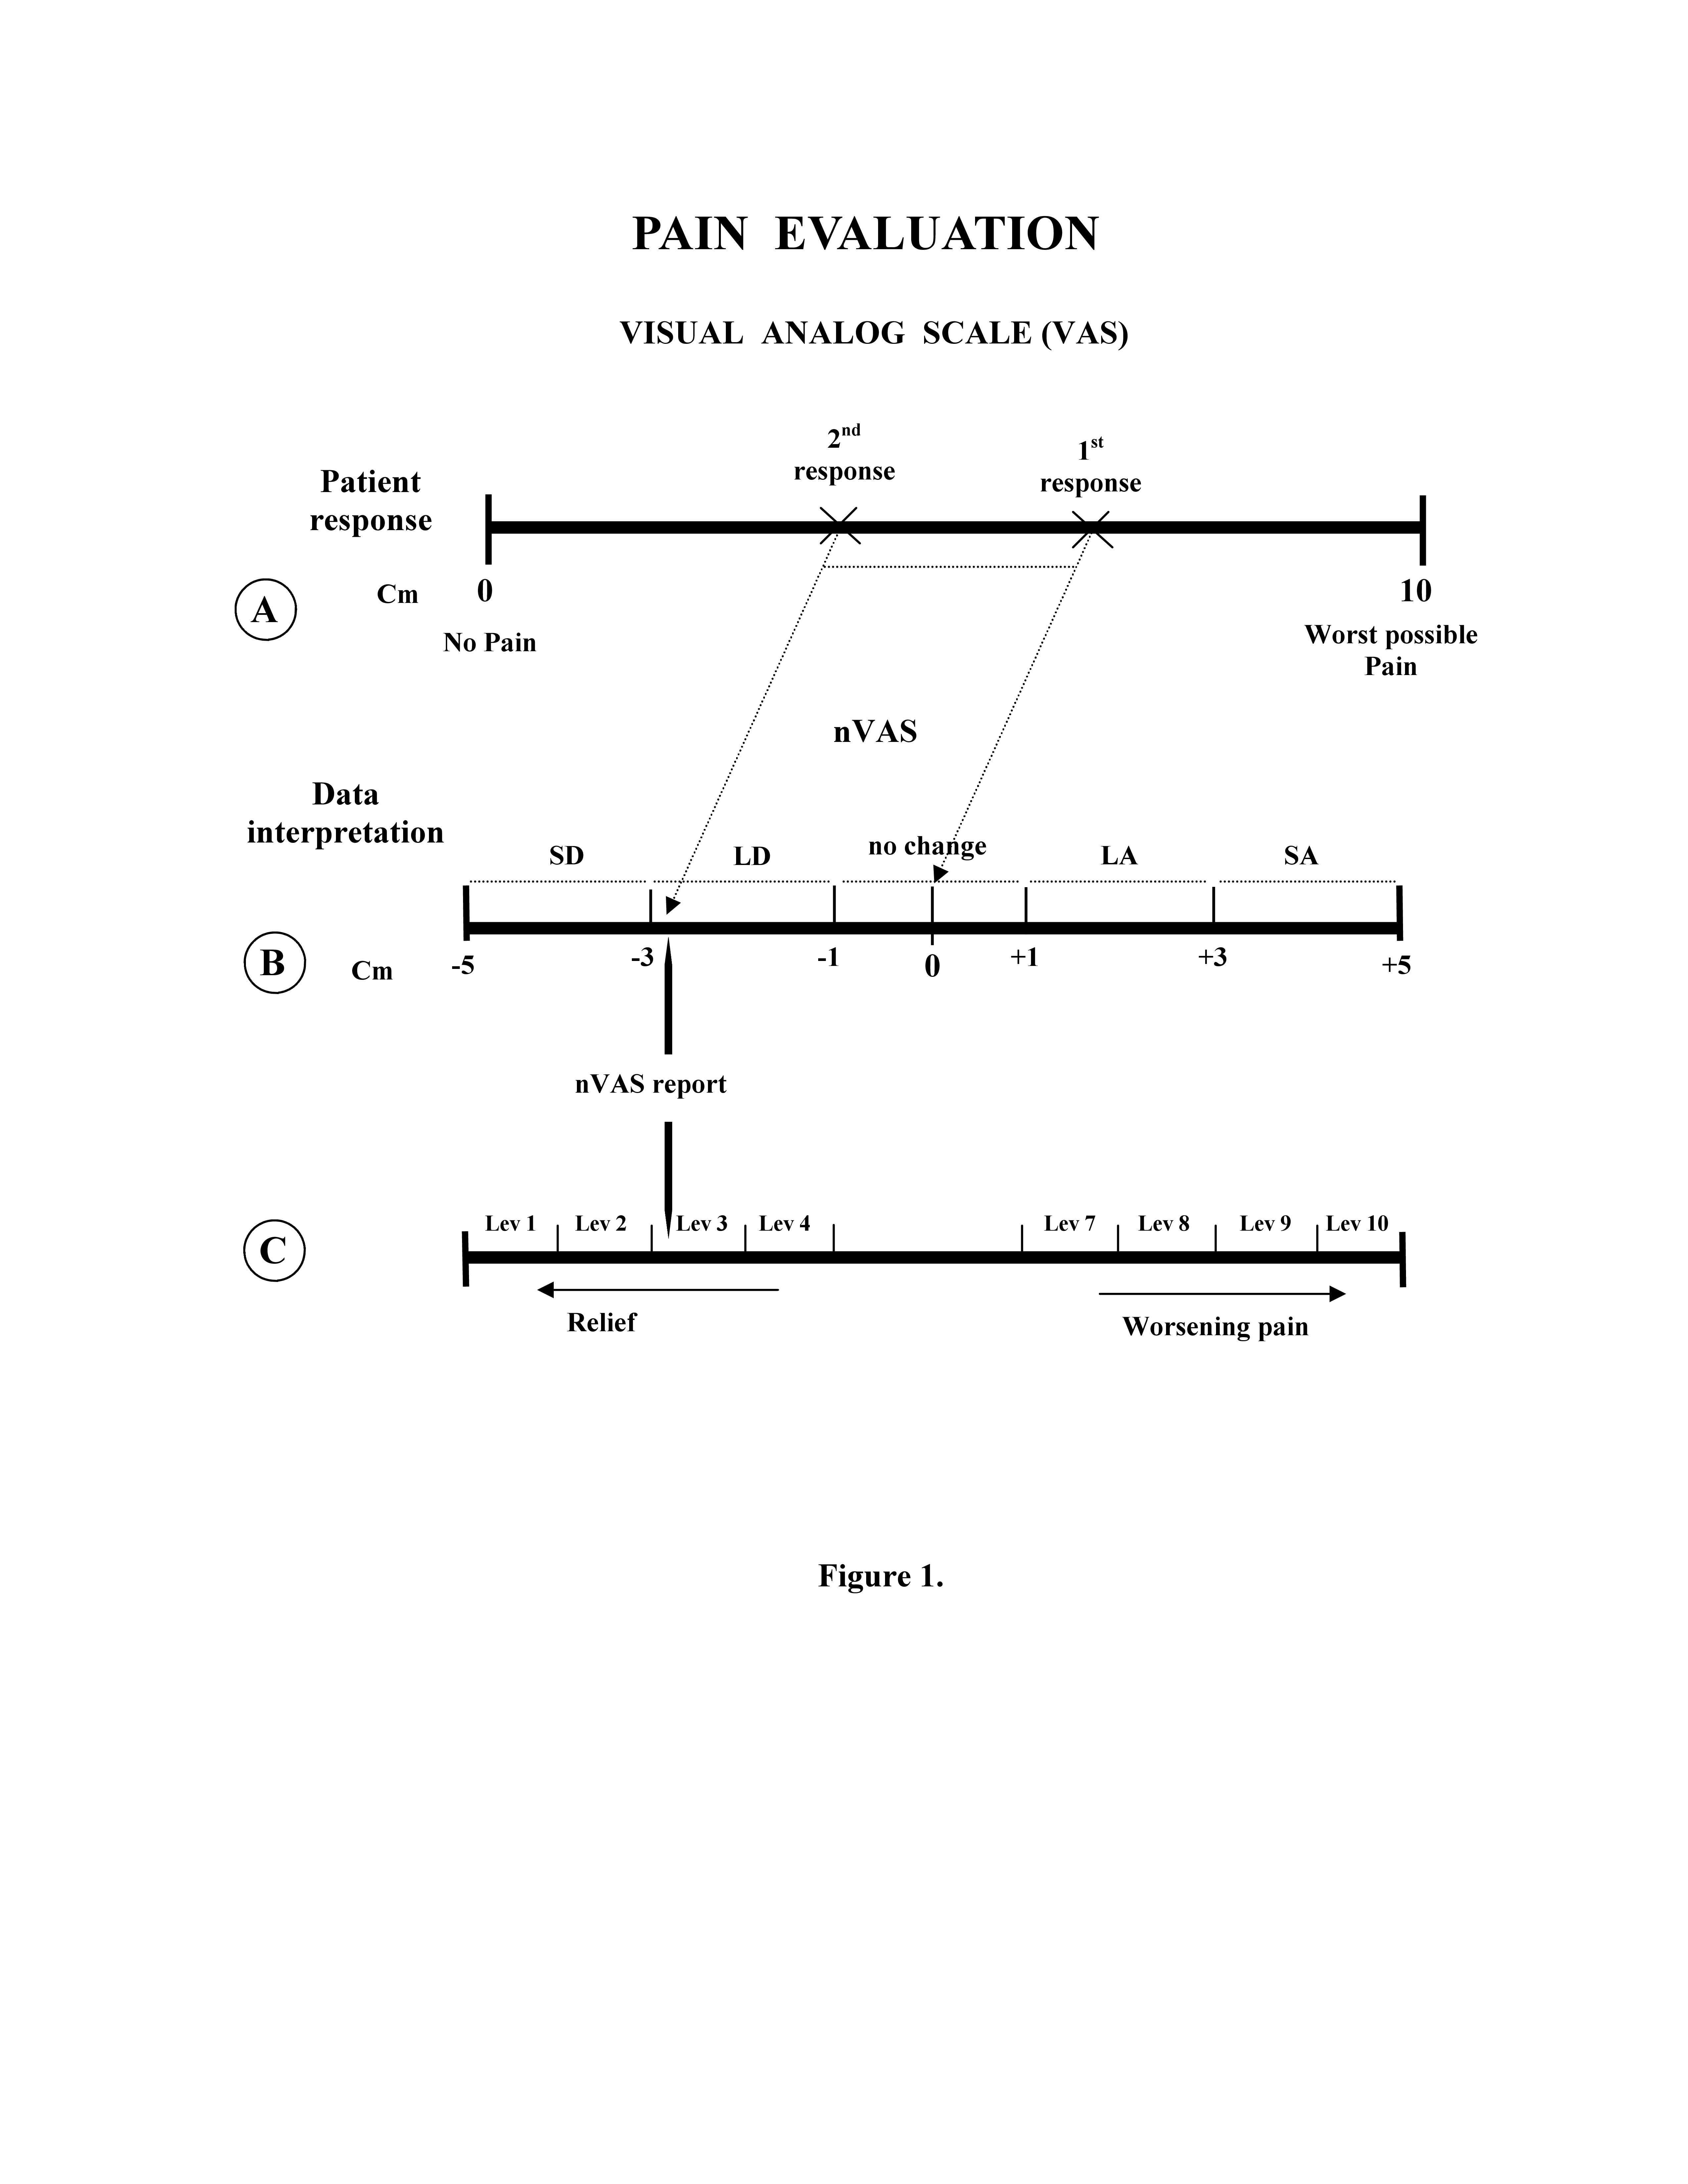
LD: lightly diminished; SD: strongly diminished; LA: lightly augmented; SA: strongly augmented;
Lev: level.
For each patient, the type of trauma, the anatomical locus of the pain, the circumstance of the trauma, age, race (Caucasian, Black and Arabic), and the time elapse between the first and second pain detection were recorded. The age was subdivided into three year ranges: 18–40, 41–70, >71, and the time between the admittance and the discharge of patients was subdivided into four ranges: 20–60 min., 61–90 min., 91–120 min., >121 min. About the circumstance of the trauma we considered: accident (vehicle accident or running down), trauma in work place, other (domestic or generic circumstances). All these records were analysed in relationship with the pain detected, to obtain a distribution of the pain change in the several categories.
Data display and statistical analysis
Data are presented as patient percentage that gave a response inside the stratification class analysed, i.e. the circumstance of the trauma.
The statistical validity of the minimal sample size (n) to be adopted in stratification classes was calculated by the formula: n= 1.962 * P (1-P) / 0.052. Where the P corresponds to the value (expressed in %) of the smallest class observed, following graphical identification of results, related to all patients enrolled in the study (independently from the circumstance of trauma); 1.96 is the value for Confidential Interval at 95%, and 0.05 corresponds to statistical error level p.
Significance of the different distributions was analysed by 2 –test, the validity of the test was assessed by the occurrence of all expected events greater than 1.0 and at least 20% of the expected events greater than 5, in each single analysis. Statistical significance was set at 95% (p< 0.05). The statistical software used was GraphPad Prism 5.00. A descriptive analysis was performed displaying the distribution of patients responses in terms of pain relief or worsening as identified along the nVAS. The low number obtained in this stratification and the asymmetric distribution of patients response, that disadvantages the most extreme intervals, makes it difficult to perform any statistical test, therefore it was not adopted.
Results
The patients included in the study were 904 of which 515 (57%) males and 389 (43%) females, with an average age of 43.3 16.9 years (mean SD). The evaluation of the minimal sample size for statistical significance, gave a number of 45 patients, for each class of stratification. Because our maximal stratification of patients takes into account 11 classes, the size of our sample amounts to 904/11 = 82 patients, that satisfies the minimum statistical sample size calculated. Statistical analysis performed by 2 –test gave significative differences between several distribution profiles of results.
Anatomical locus
Stratifying the results of nVAS pain detection related to anatomical locus affected by injury (Figure 2A), we observed that the cervical spine is the locus where, for the major part of patients, we have detected no change in pain after ED management, whereas a worsening of pain symptoms was detected for a little number of patients only. Relatively to upper limbs (shoulder, arm, elbow, wrist, hand), for the majority of patients we have detected no pain change or a lightly diminished pain. In particular, the elbow resulted the locus in which the response “no pain change” has been detected with higher frequency, while only for the hand we detected strongly decreased pain. The pelvis was the locus for which we have detected the best level of pain relief, because no patients have indicated pain worsening, and the number of patients indicating no pain change was lower of that indicating strongly and lightly diminished pain. In particular patients who declared a strong reduction of their pain after ED management were more numerous than those observed in any other class of stratification. Within the regions of the lower limb, for ankle and foot the largest number of patients indicated diminished pain. But knee, ankle and foot, were also the loci for which we have detected the largest number of patients declaring a strongly worsening pain after ED management (Figure 2A). Analysing the overall distribution in terms of pain relief we observed a prevalence of the two intermediate levels (Lev2 and 3) (Figure 2B), whereas in the distribution regarding pain worsening prevailed the lowest level (Lev7) (Figure 2C). We noted also an increasing gradual trend in pain worsening among patients with trauma at foot (Figure 2C).
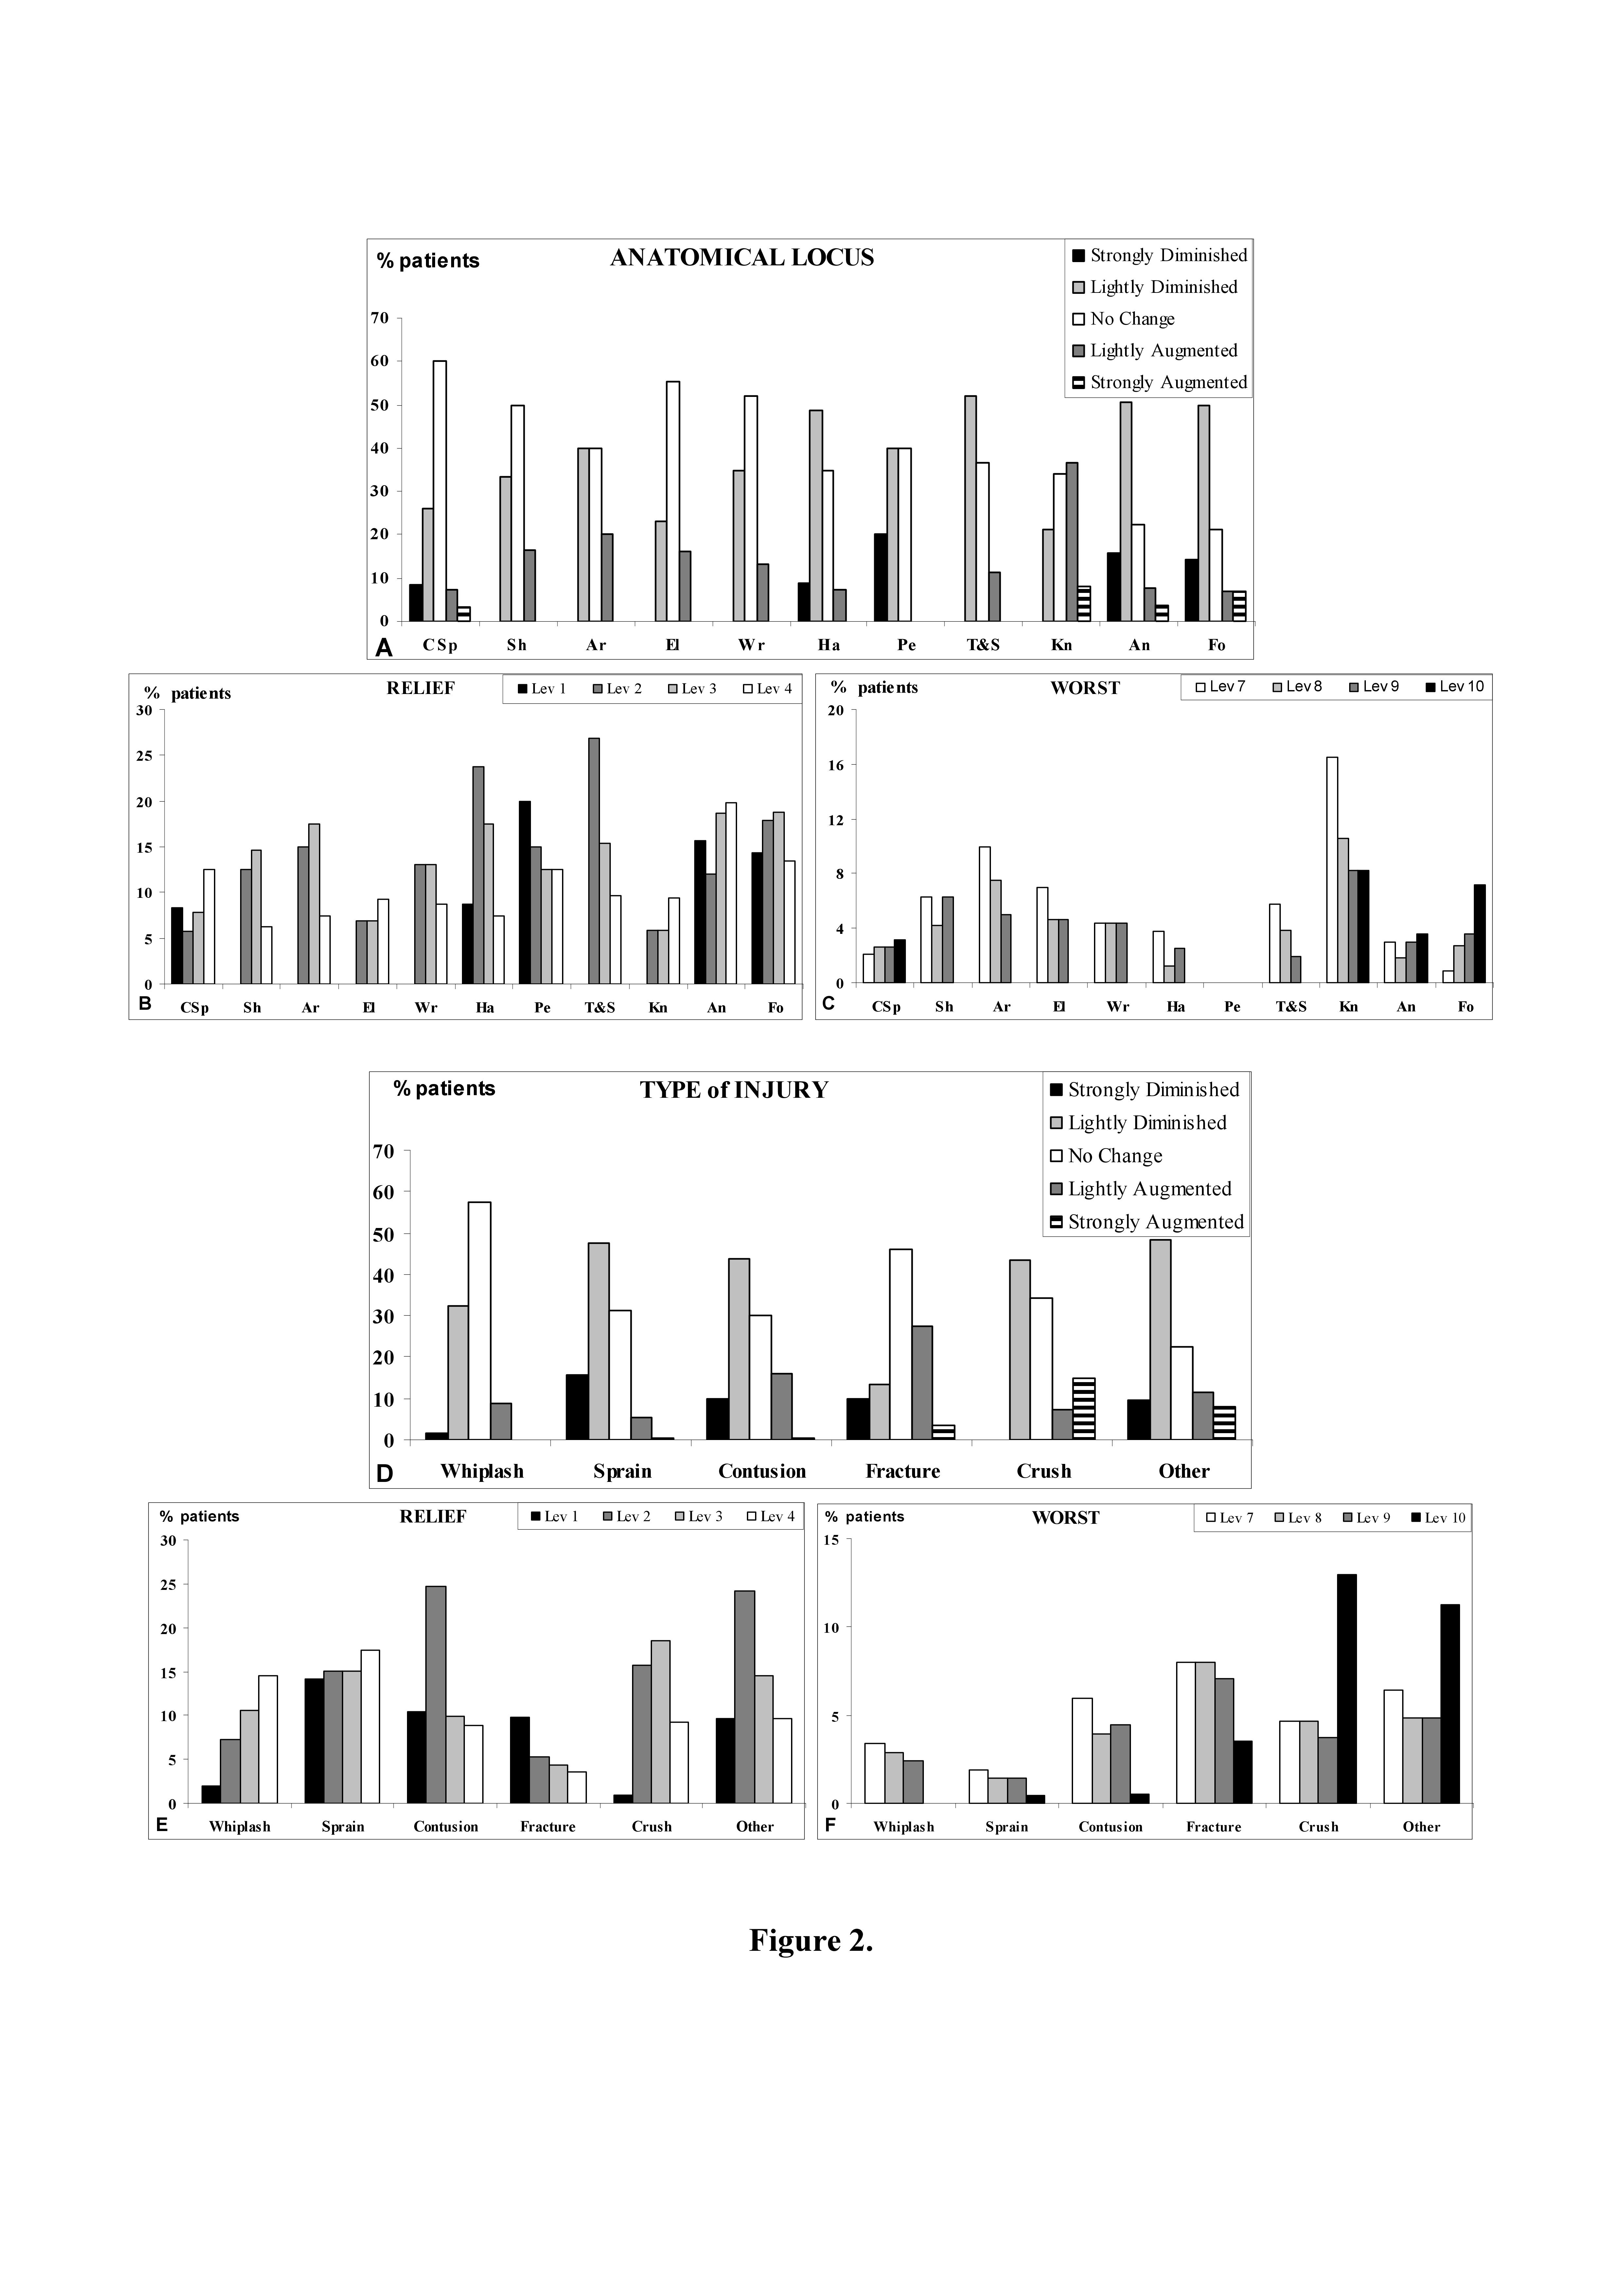
CSp: cervical spine; Sh: shoulder; Ar: arm; El: elbow; Wr: wrist; Ha: hand; Pe: Pelvis; T&S: thigh and shin; Kn: knee; An: ankle; Fo: foot; Lev: level.
Type of injury
Stratifying the nVAS patients indication related to type of injury (Fig Figure 2D), we observed that whiplash and fracture represent the injuries for which the most of patients indicated no pain change after ED management. Sprain, contusion and others are the injuries for which the largest number of patients have reported diminished pain, being sprain the injury for which the highest number of patients have reported a strong pain reduction. Instead, fracture, crush and others represent the injuries for which a consistent number of patients have indicated a strong pain worsening, being crush the injury for which the highest number of patients have reported strong pain increase (Figure 2D). Analysing the pain relief response distribution, we have observed a rather heterogeneous distribution along several levels of the nVAS. Whiplash and fracture injuries showed a gradual and opposite response distribution: for whiplash injury the highest number of response were detected in Lev3 and 4, while for fracture injury they were Lev1 and 2. These findings reflect the high number of lightly decreased pain responses detected in whiplash injury, and the high number of strongly decreased pain responses detected in fracture injury (Figure. 2E). Analysing the distribution of pain worsening responses, we have observed that crush and other injuries displayed the highest pain worsening, identifiable in the high number of Lev10 responses detected (Figure 2F).
Time lapsing between ED admission and discharge
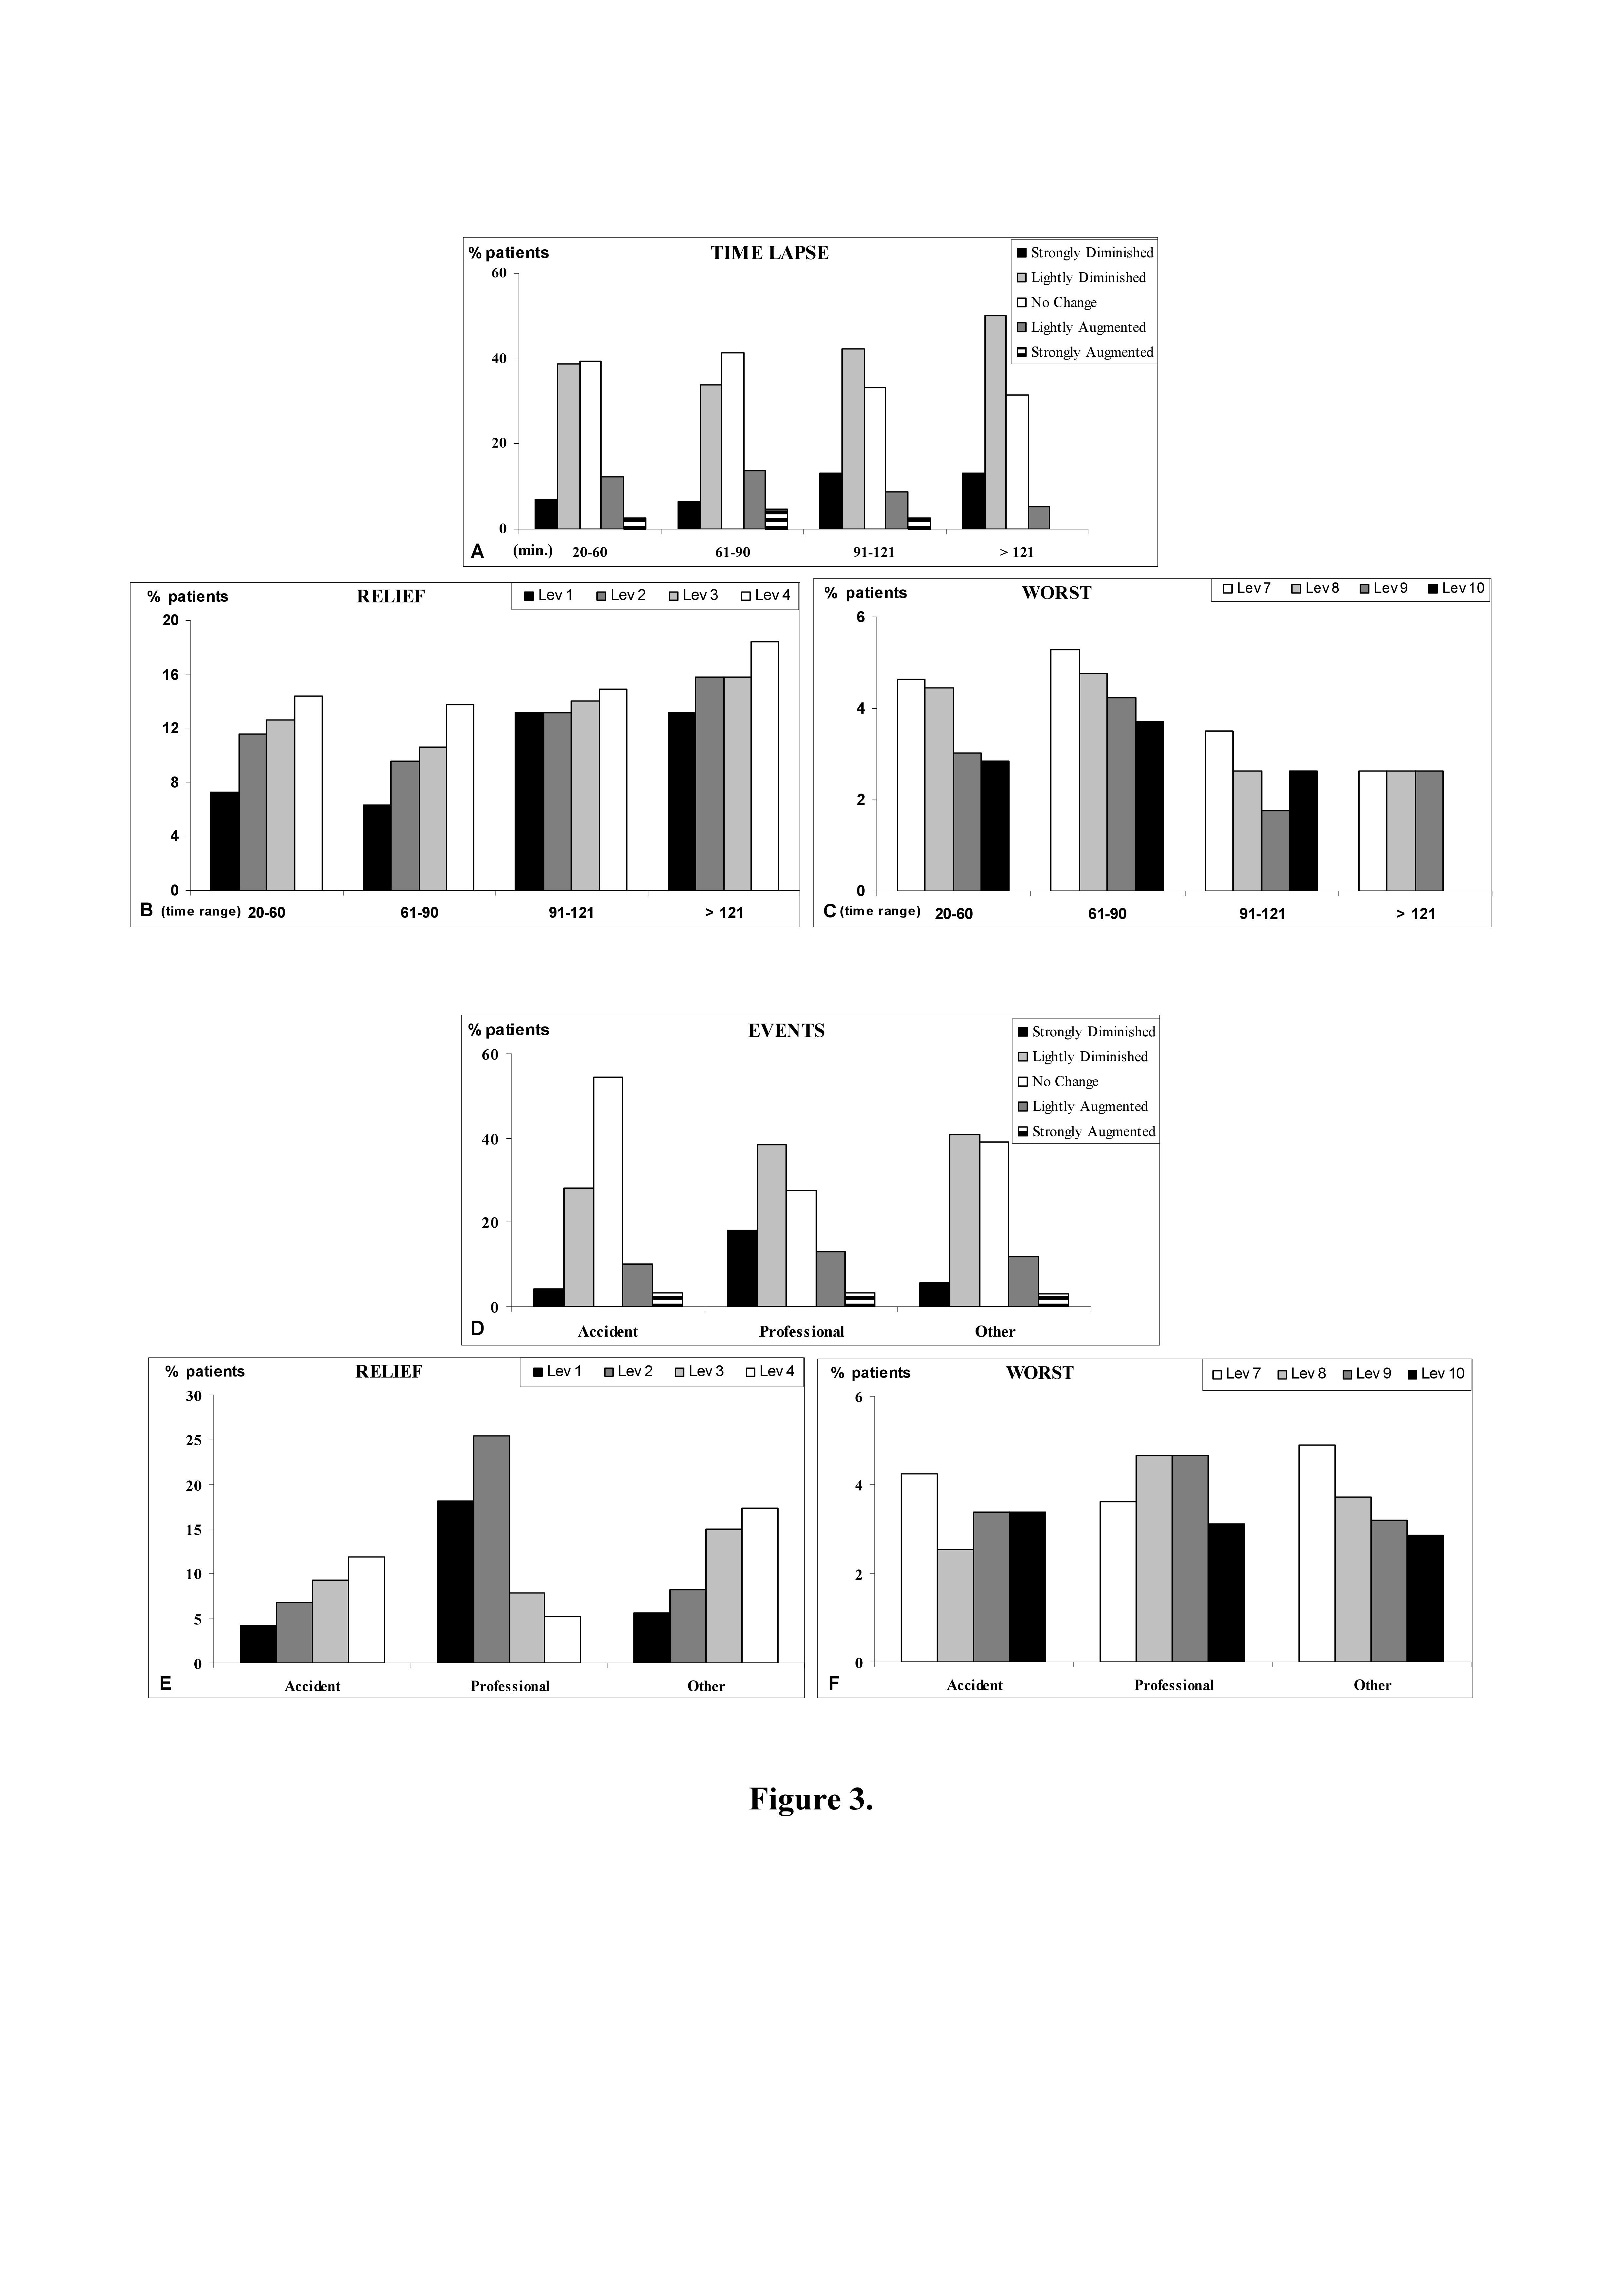
The time lapse between ED admission and discharge influenced the pain change detected (Figure 3A): in particular we observed a prevalence of no change or light decrease in pain response, within 90 minutes from the first detection; instead the time lapses over 1,5 hour (range time: 91-121 and >121) were found to be associated to a more marked pain decrease (Figure 3A).
The analysis of pain relief and pain worsening displayed a gradual distribution of patients responses decreasing in number towards the end levels of the scale (respectively Lev1 and Lev10) for the time lapses inferior to 1,5 hour, while the distribution of patients responses at the time lapses over 1,5 hour showed a more homogenous display among several Levels (Figures 3 B and C).
Events
Stratifying the pain change in relationship to different events related to the environment in which injury occurred (Figure 3D), we observed that professional environment is associated to a large improvement of pain in comparison to the other two considered classes, while the number of augmented pain responses detected is rather constant between the three different classes (Figure 3D).
The analysis of pain relief displayed a gradual distribution of patients responses decreasing towards the end level of the scale (Lev1), exception made for professional events showing an asymmetric distribution of patients response, that privileges the end levels of the scale (Lev1 and 2) (Figure 3E).
Age
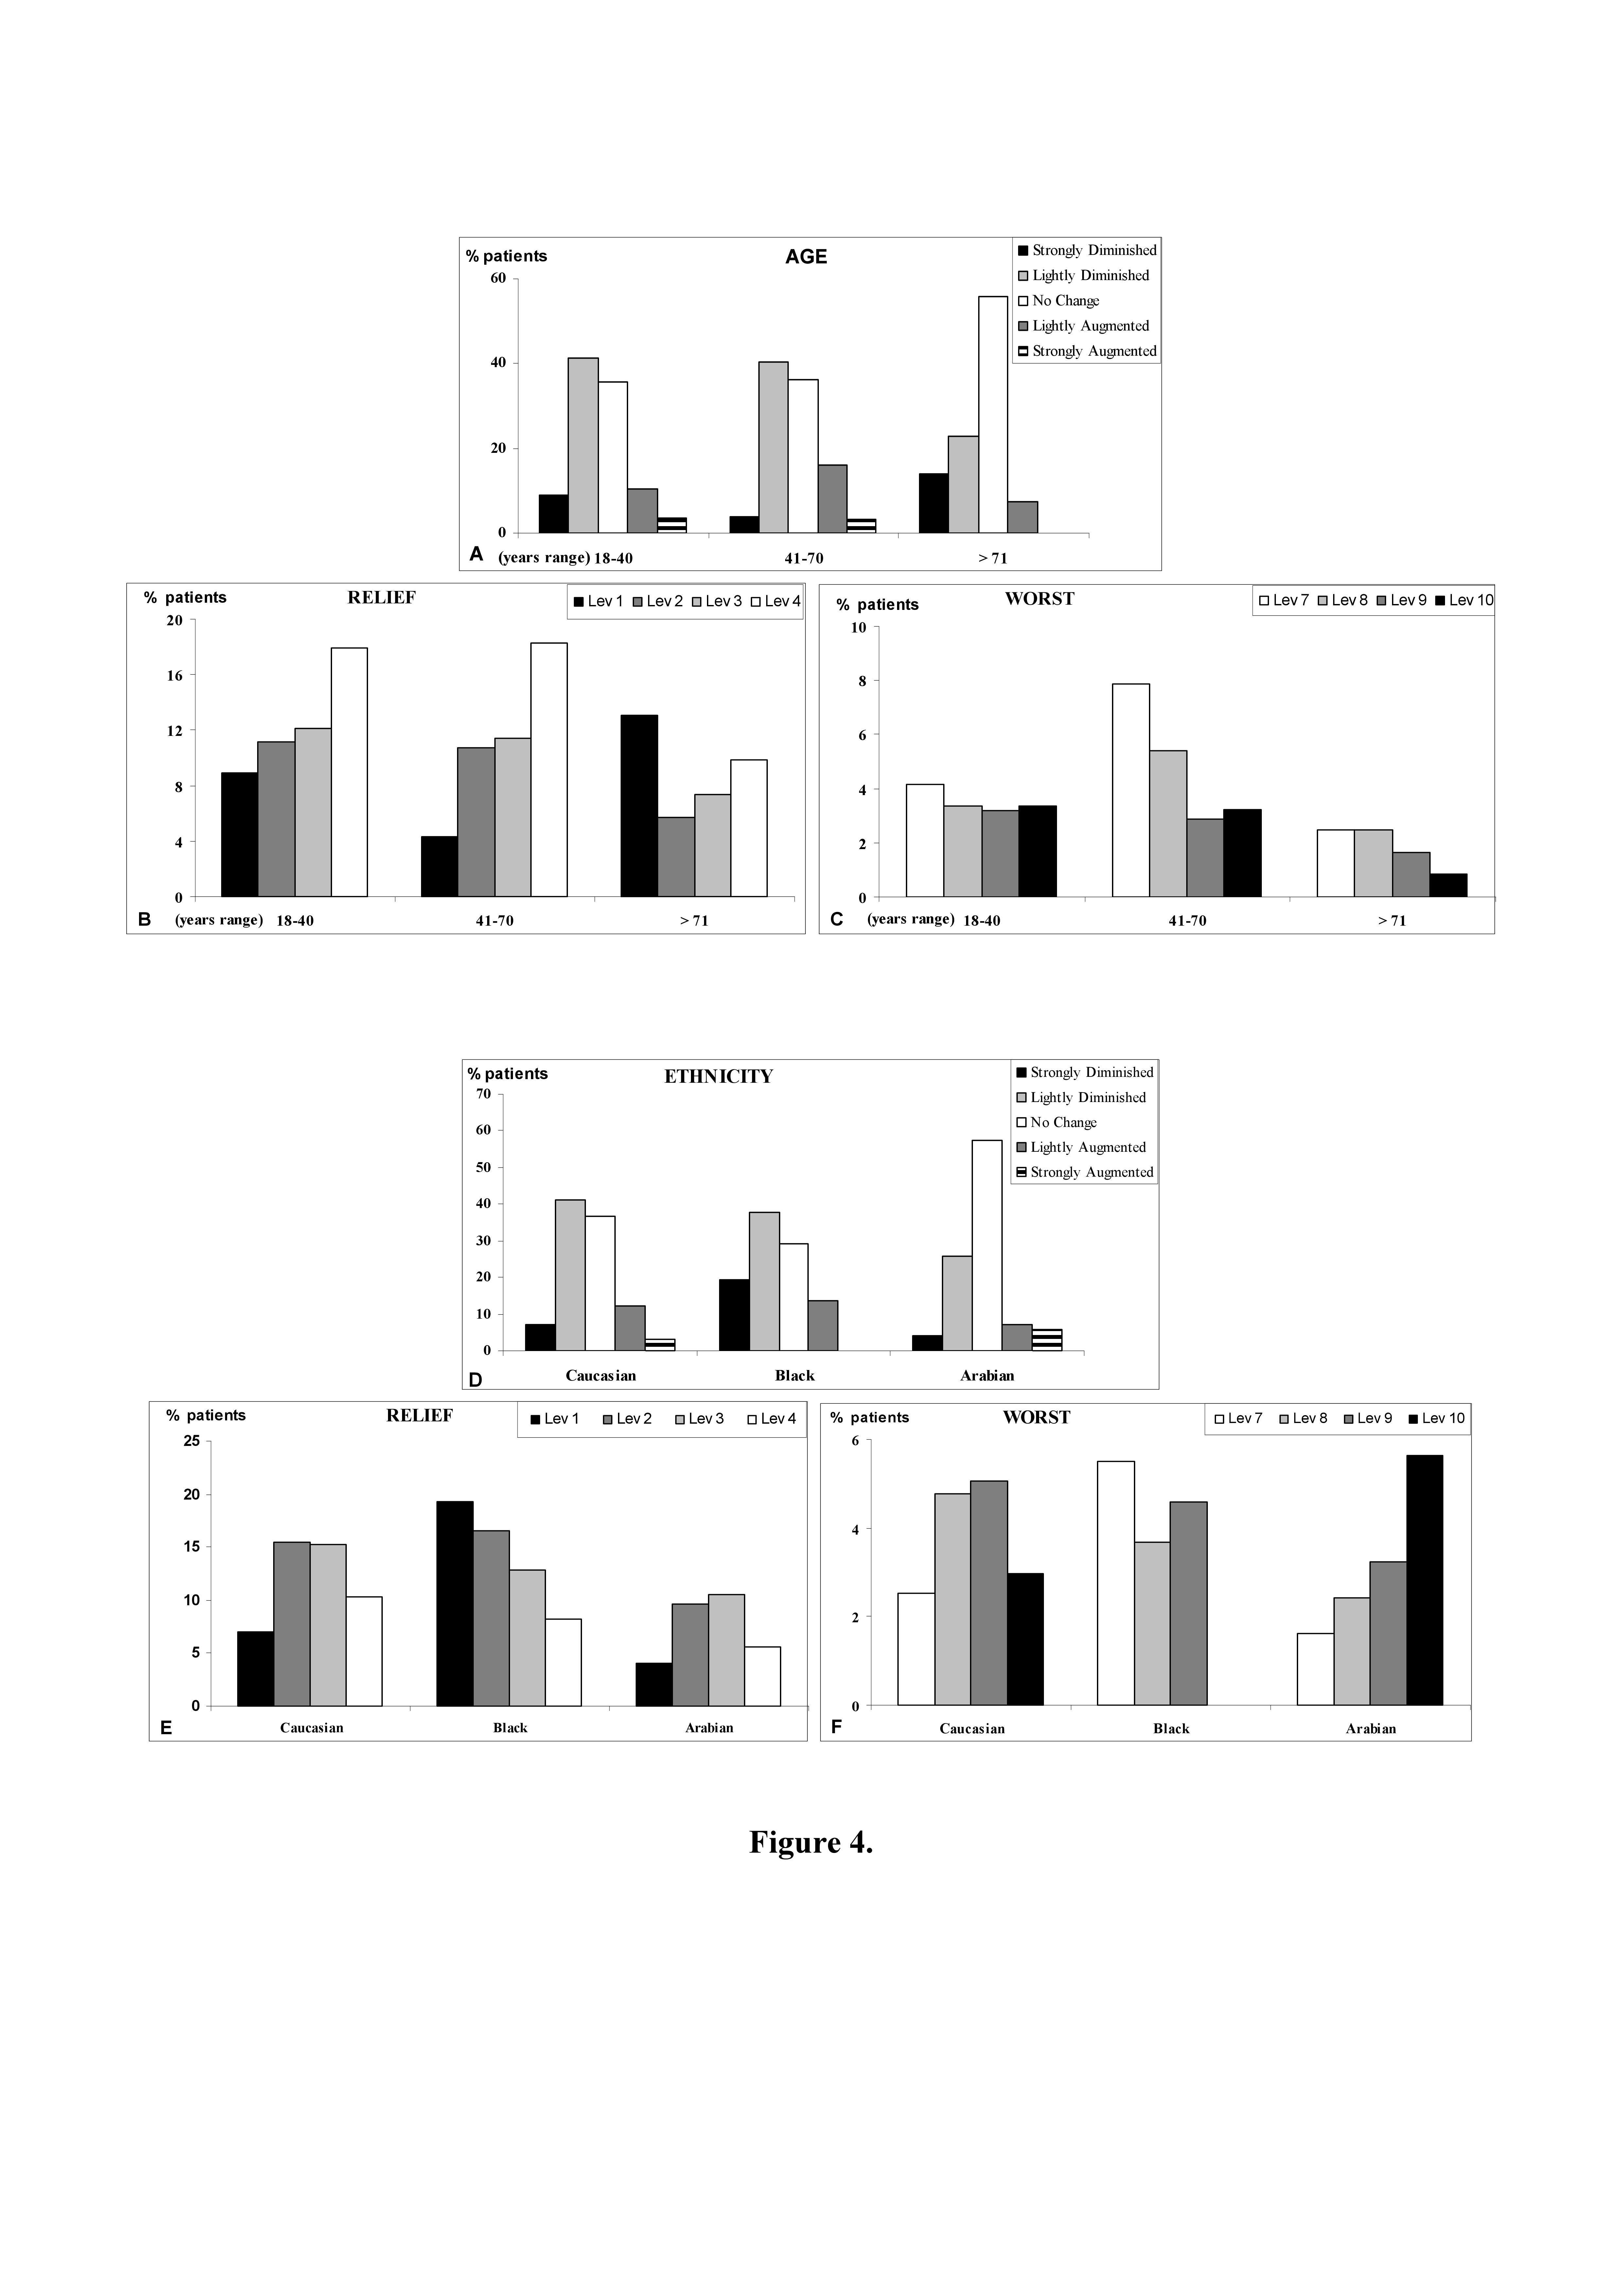
Stratifying the pain change in relationship to different age ranges (Figure 4A), we observed that the younger range (18-40 years) was characterised by the highest response in terms of diminished pain, following ED management, while the oldest range (>71 years) was characterised by the highest response in terms of no pain change; furthermore the oldest range showed a very low detection in terms of pain increase (Figure 4A).
The analysis of pain relief showed in the oldest range a high frequency of response concentrated at the Lev1 corresponding to high decrease of pain, while in the other ranges predominates the response detected at the Lev4 corresponding to low decrease of pain (Figure 4B).
The analysis of pain worsening showed that the intermediate range (41-70 years) was characterised by a relative high frequency of responses at Lev7 and 8 indicating a response related to a light worsening of pain (Figure 4C). These findings highlight a good pain tolerability in older patients, following acute musculoskeletal trauma, but indicate a positive response in terms of pain reduction in younger patients too.
Ethnicity
Stratifying the pain change in relationship to ethnicity (Figure 4D), we observed that Black patients were characterised by high frequency of response in terms of pain reduction following ED management, while Arabian patients were characterised by high frequency of response in term of no pain change (Figure 4D).
The analysis of pain relief showed a particular distribution of pain change response in Caucasian and Arabian patients, which privilege the intermediate level of the scale (Lev2 and 3). Instead a gradual distribution can be observed for the response of Black patients, where the end of the scale is privileged (Lev1) (Figure 4E).
The analysis of pain worsening showed a symmetrical response of Caucasian patients privileging the intermediate level of the scale (Lev8 and 9), while Arabian patients pain responses were gradually distributed, privileging the terminal end of the scale (Lev10): therefore the response of pain worsening was relatively high (Figure 4F).
Discussion
VAS can be considered a useful tool in determining the pain change in terms of worsening or relief. In particular this scale was considered appropriate for this study, because it allowed us to detect the pain at the second time without patients did remember the exact numerical value of the previous check. However, even if the validity of this scale has been assessed in reporting a good accord to Numerical Rating Scale and patient response (9,15), the indication of quality-quantity use of the scale is not so simple. In those situations in which narrow intervals between scores may rather indicate no pain change, and in those situations in which scores proximal to the ends of the segment may indicate rather a more emotive than appropriate response of perceived pain, the VAS use may have serious limitations. A mathematical approach to VAS results has been performed measuring the patients indication and it has been reported that the minimum clinically significant change in patient pain severity was 13 mm, and studies of pain experience that report less than a 13 mm change in pain severity, although statistically significant, may have no clinical relevance (16). Furthermore Kelly and coll. (10) have highlighted that patient satisfaction does not correlate well with change in VAS pain score in the ED. Indeed factors such as patient expectations, communication between patients and health care workers, and satisfaction with other aspects of care greatly influence the pain evolution. Indeed, the final response of patients pain change is important to address amelioration in the patients care and management (5).
Following these considerations, we have applied a novel interpretation to VAS, reporting patients scoring in a further 10 cm normalised-VAS segment (nVAS), where a central and symmetrical “blank zone” was drawn. The patient’s scoring falling within was considered without relevance in terms of pain change. Furthermore to manage comparable and analysable results expressing a real distance between pain change experienced by patients, the remaining interval of nVAS was collected in two main zones, proximal and distal to central “blank zone” (of 2 cm in length), respectively for the relief zone (segment 1 – 4 cm) and for the worst zone (segment 6 – 10 cm). To better analyse the distribution of patients response in terms of pain relief or worsening the relief and worsening zone were subdivided into 4 intervals each.
Previously in a study (17) the pain referring only to musculoskeletal trauma was reported with a significative reduction of VAS score following ED managements, but the authors in their study did not specify the type of the different musculoskeletal traumas. Therefore in the present work we analysed data related to pain change in acute musculoskeletal pain following ED management, stratifying data not only compared with different musculoskeletal traumas, but also with other human and environmental parameters in which injuries occurred.
We observed that most part of patients declared a reduction of pain following ED management, and this response was differently influenced by several analysed parameters. Several circumstances were detected in which pain relief may be obtained following ED management. These findings indicated that in these cases the acute musculoskeletal pain may be effectively treated inside the ED operativity and a reduction of the requirement of analgesic administration may be expected.
Otherwise a large part of patients declared no change in pain after ED management and this response is rather constant and scarcely affected by several considered circumstances. These findings pay attention to a correct and carefully information about pain management and analgesic administration at patients discharge (18).
Conclusions
In the management of patients’ pain it is important the individuation of those conditions that may be associated with a worsening in perceived pain. The patient should be carefully informed on how to behave for better managing pain and the need to implement strategies to alleviate pain assumes particular importance.
Acknowledgements
We are grateful to Miss Vanessa Grillo, who helped us in data collection for her graduation thesis on this topic.
References
1. Ducharme J, Barber C. A prospective blinded study on emergency pain assessment and therapy. J Emerg Med 1995; 13: 571-575.
2. Afilalo M, Tselios C. Pain relief versus satisfaction. Ann Emerg Med 1996; 27: 436-438.
3. Todd KH, Sloan EP, Chen C, Eder S, Wamstad K. Survey of pain etiology, management, and satisfaction in two urban emergency departments. Can J Emerg Med 2002; 4: 252-256.
4. Rupp T, Delaney KA. Inadequate analgesia in emergency medicine. Ann Emerg Med 2004; 43: 494-503.
5. Pierik JG, Ijzerman MJ, Gaakeer MI, Berben SA, van Eenennaam FL, van Vugt AB, Doggen CJ. Pain management in the emergency chain: the use of effectiveness of pain management in patients with acute musculoskeletal pain. Pain Med 2014; 16: 970-984.
6. Suarez-Almazor ME, Conner-Spady B, Kendall CJ, Russel AS, Skeith K. Lack of congruence in the ratings of patients’ health status by patients and their physicians. Med Decis Making 2001; 21: 113-121.
7. Mäntyselkä P, Kumpusalo E, Ahonen R, Takala J. Patients’ versus general practitioners’ assessments of pain intensity in primary care patients with non-cancer pain. Br J Gen Pract 2001; 51: 995-997.
8. Gordon DB, Dahl JL, Miaskowski C, McCarberg B, Todd KH, Paice JA, Lipman AG, Bookbinder M, Sanders SH, Turk DC, Carr DB. American pain society recommendations for improving the quality of acute and cancer pain management: American Pain Society Quality of Care Task Force. Arch Intern Med 2005; 165: 1574-1580.
9. Stahmer SA, Shofer FS, Marino A, Shepherd S, Abbuhl S. Do quantitative changes in pain intensity correlate with pain relief and satisfaction? Acad Emerg Med 1998; 5: 851-857.
10. Kelly AM. Patient satisfaction with pain management does not correlate with initial or discharge VAS pain score, verbal pain rating at discharge, or change in VAS score in the Emergency Department. J Emerg Med 2000; 19: 113-116.
11. Woolf AD, Zeidler H, Haglund U, Arr AJ, Chaussade S, Cucinotta D, Veale DJ, Martin-Mola E. Arthritis Action Group. Musculoskeletal pain in Europe: its impact and a comparison of population and medical perceptions of treatment in eight European countries. Ann Rheum Dis 2004; 63: 342-347.
12. Leigheb M, Di Monte R, Ceffa R, Gamberoni D, Marcuzzi A, Grassi, F. Satisfaction and Quality of life after reduction and internal fixation of radius fractures at the wrist. JHS Eu 2015; 40 (Suppl 1): 129-30.
13. Guru V, Dubinsky I. The patient vs. caregiver perception of acute pain in the emergency department. J Emerg Med 2000; 18: 7-12.
14. Price DD, McGrafth PA, Rafii A, Buckingham B. The validation of visual analogue scales as ratio scale measure for chronic and experimental pain. Pain 1983; 17: 45-46.
15. De Boer AG, van Lanschot JJ, Stalmaier PF, van Sandick JW, Hulscher JB, de Haes JC, Sprangers MA. Is a single-item visual analogue scale as a valid, reliable and responsive as multi-item scales in measuring quality of life? Qual Life Res 2004; 13: 311-320.
16. Todd KH, Funk KG, Bonacci R. Clinical significance of reported changes in pain severity. Ann Emerg Med 1996; 27: 485-489.
17. Johnston CC, Gagnon AJ, Fullerton L, Common C, Ladores M, Forlini S. One-week survey of pain intensity on admission to and discharge from the emergency department: a pilot study. J Emerg Med 1998; 16: 377-382.
18. De Berardinis B, Magrini L, Calcinaro S, Castello LM, Avanzi GC, Semplicini A, Alzetta M, Giordano B, Di Somma S. Emergency department pain management and its impact on patients’ short term out come. Open EMDJ 2013; 5. 1-7.